















A manufacturing cost comparison by state is not about finding the single "cheapest" state. It's about matching the cost structure of your product to the states where those specific costs are lowest. A labor-intensive assembly line, an energy-hungry foundry, and a warehouse-heavy kitting operation will each rank the fifty states in a completely different order.
This guide breaks the decision into the four cost buckets that actually move the number (labor, energy, industrial rent, and tax/incentives), gives you current 2025 to 2026 benchmarks, and hands you a manufacturing location checklist you can run against real quotes. If you're weighing domestic production against an overseas plant, pair this with our landed cost formula so you're comparing apples to apples.
The short version: pick your site the way you'd choose a contract manufacturing partner, by modeling the whole cost stack, not by chasing one headline rate.
Why a Manufacturing Cost Comparison by State Is Harder Than It Looks
The instinct is to grab a "cheapest states" list and stop. The problem is that those lists average across industries. Your cost mix is specific, and the state that wins on wages can lose badly on electricity.
Site advisors keep making this point. Location selection is a weighted problem, not a single-number problem. Smart manufacturing site selection means finding where incentives, workforce, infrastructure, and long-term costs align, and firms that treat it as a purely financial exercise miss the variables that determine whether a facility actually performs.
The scale of what's in motion tells you why states are competing so hard. More than $1.743 trillion in manufacturing investments have been announced since 2025 across 140 companies and 35 states, which means incentive packages are richer and more negotiable than they've been in a decade.
The Four Cost Buckets That Actually Move the Number
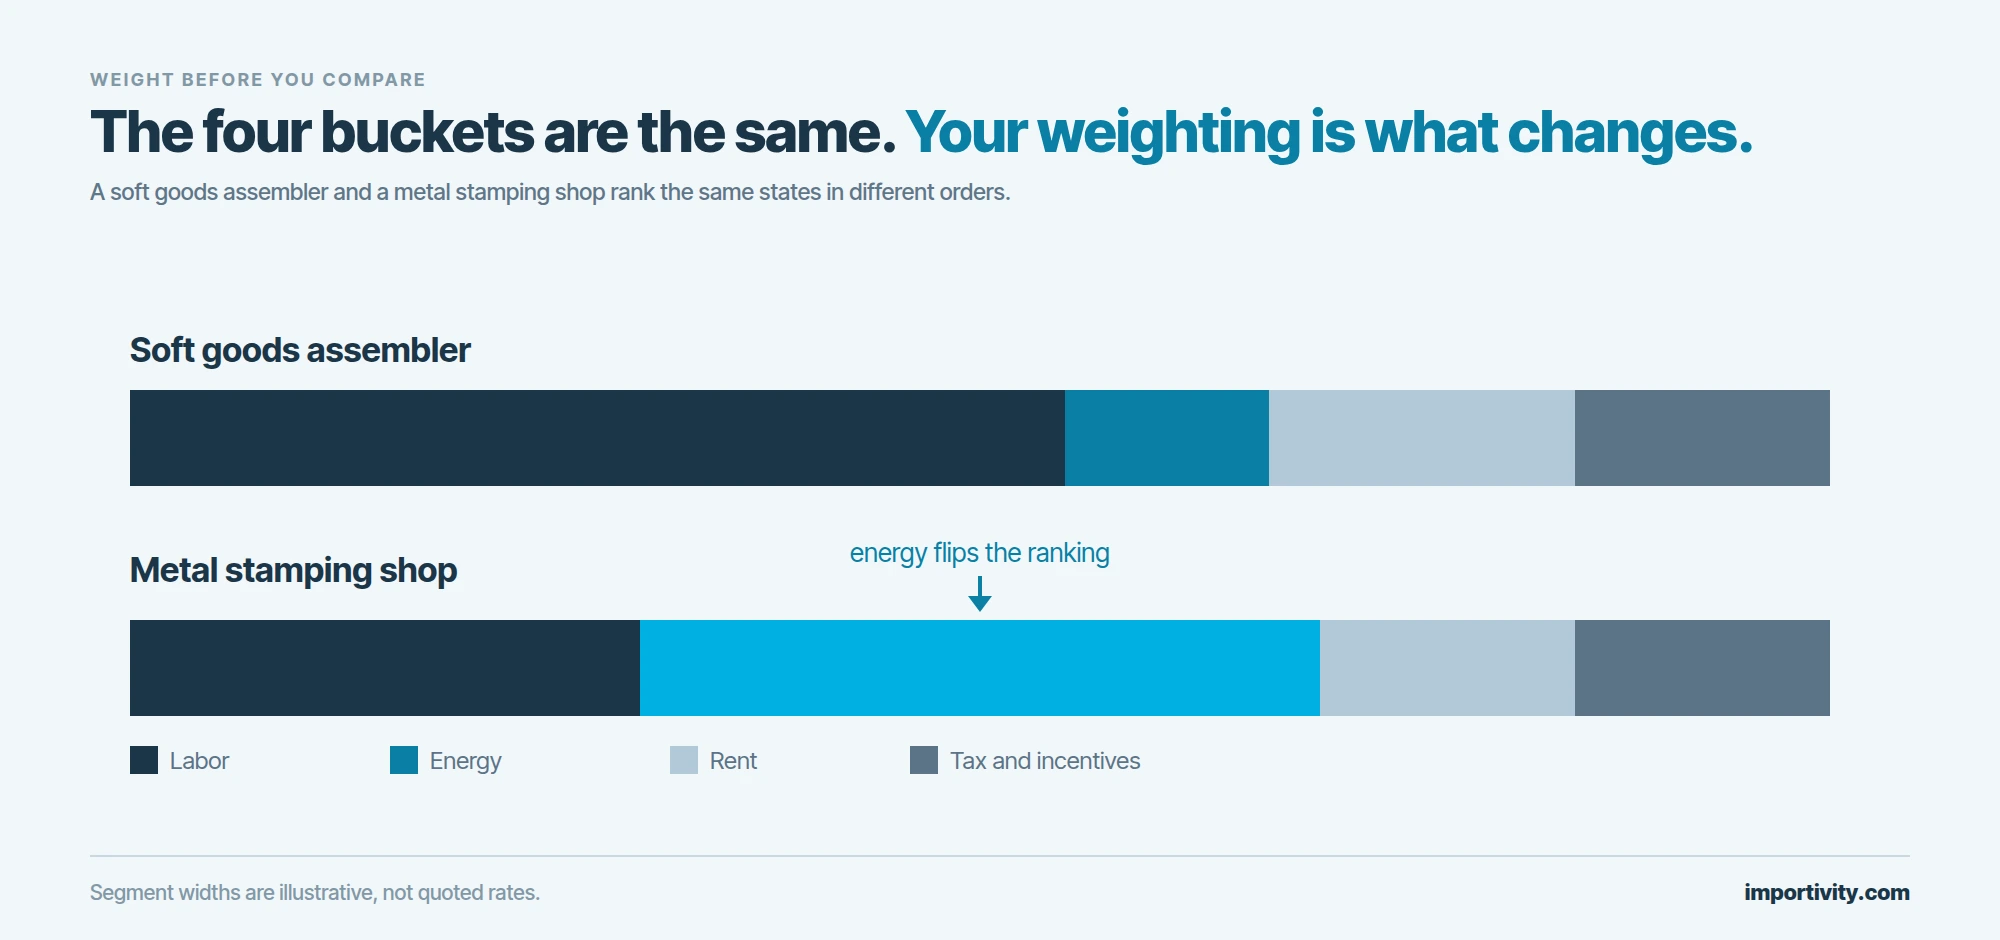
Before you compare states, weight these four buckets by how much each represents in your cost structure. A metal-stamping shop is energy-and-machinery heavy; a soft-goods assembler is labor heavy. Your weighting is your comparison.
1. Labor
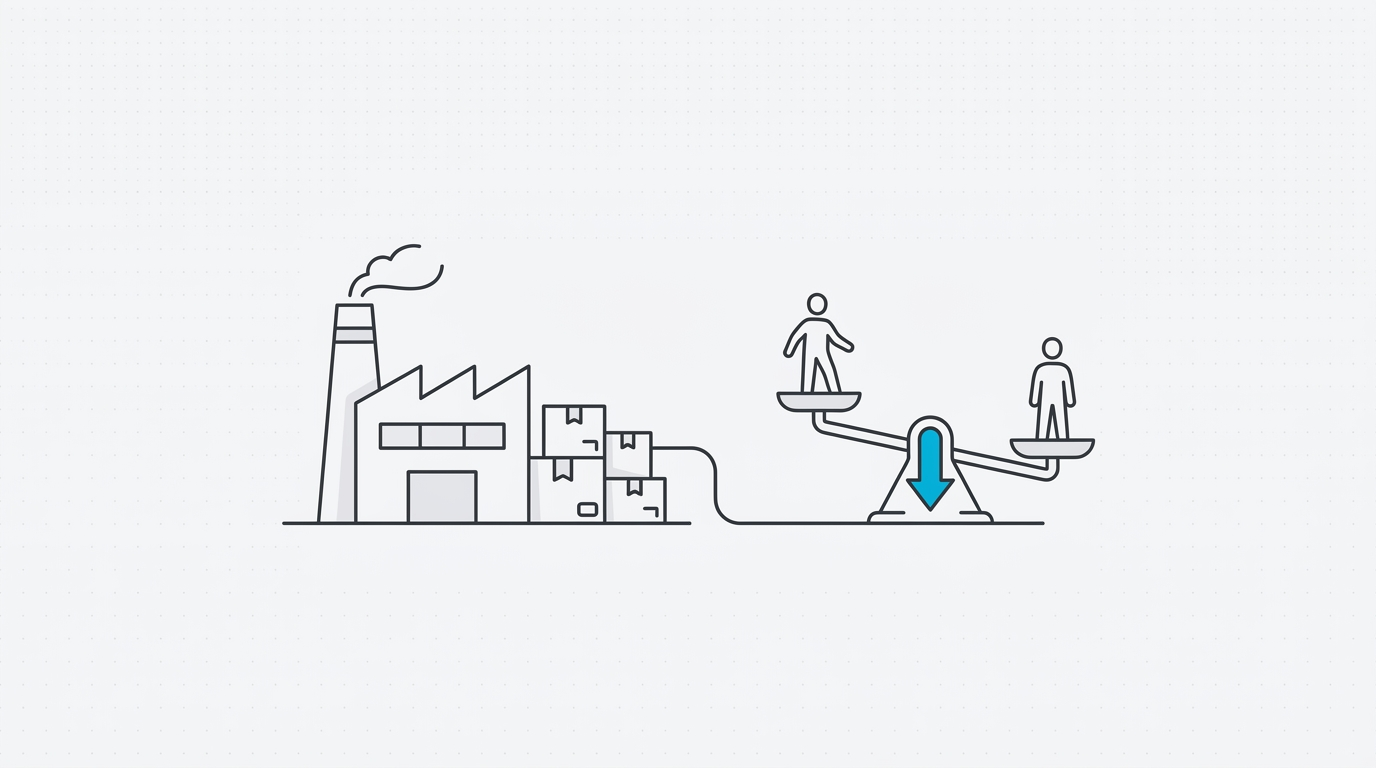
Labor is usually the single largest controllable line. The national average for all manufacturing employees is $36.07 per hour as of December 2025, and production and nonsupervisory workers, who make up about 70% of the manufacturing workforce, earn $29.51 per hour. But those averages hide big regional gaps.
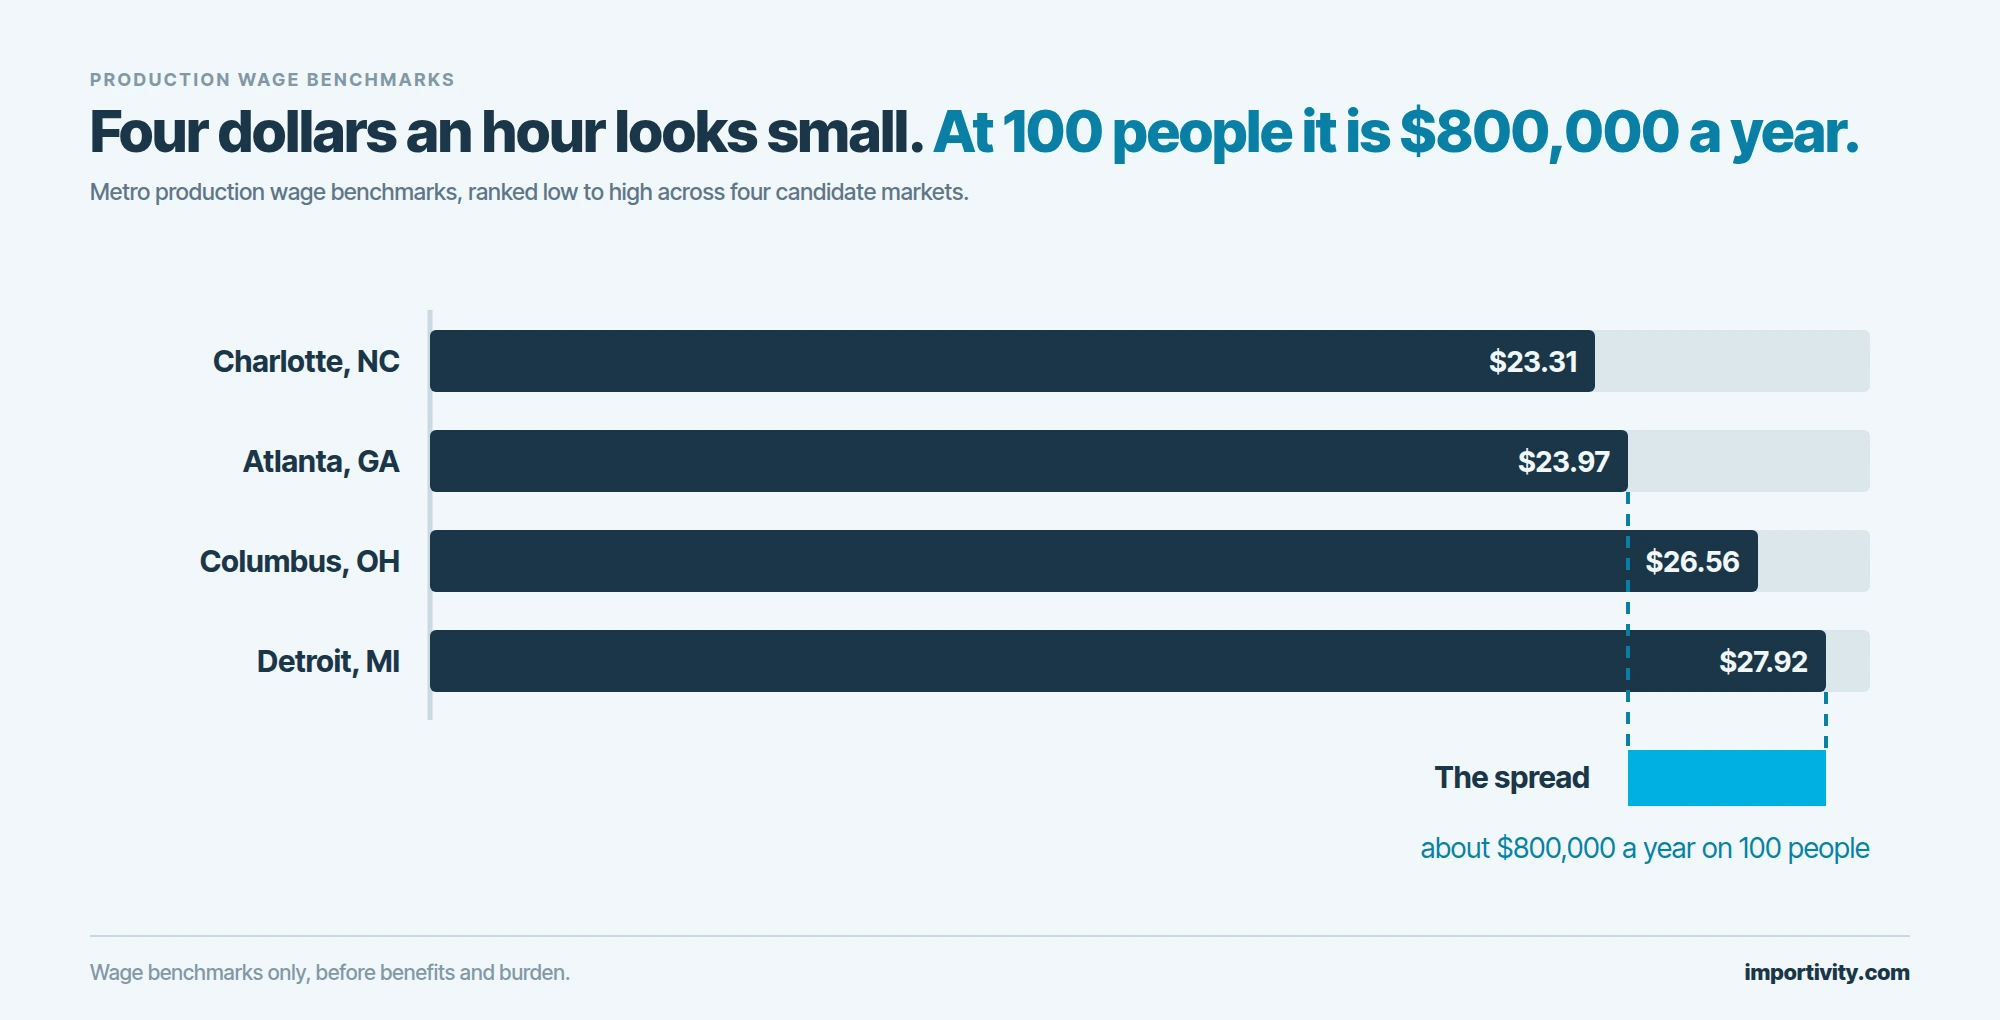
To see the spread: Atlanta combines low energy costs of 6.54 cents per kWh, competitive wages of $23.97 per hour, and some of the lowest commercial rents in the dataset at $7 per square foot per year. Compare that to a Midwest automotive hub, where Detroit's average wages run higher than southern states at $27.92 an hour, offset by affordable industrial rents around $9 per square foot and deep expertise in metal fabrication and heavy industry. On a 100-person plant, that wage gap alone is roughly $800,000 a year before benefits.
2. Energy
For anything with furnaces, presses, molding, or plating, electricity can rival labor. And energy prices are climbing fast. National residential rates rose from 15.94 cents per kWh in January 2025 to 17.45 cents in January 2026, while industrial rates climbed 11.4%.
The state spread is enormous. The average U.S. commercial electricity rate is 13.51 cents per kWh as of July 2026, ranging from 7.44 cents in North Dakota to 38.79 cents in Hawaii. Site advisors flag the outliers as disqualifiers for energy-intensive work: states with high current rates and high historic growth tend to be significantly less favorable for long-term investments in advanced manufacturing facilities.
3. Industrial Rent
Rent matters most for high-footprint, low-density operations. Nationally the market has loosened. The national average asking rent for warehouse and industrial space was $9.12 per square foot annually in 2025, with coastal California markets hitting $15 to $17 while Midwest locations run $6 to $8.
Softening vacancy is quietly a cost lever. Vacancy rates hit 7.1% nationally in Q2 2025, the highest in over a decade, which gives manufacturers more negotiating power than they've had in years. Use that leverage; the asking rent is a starting point, not the price.
4. Taxes and Incentives
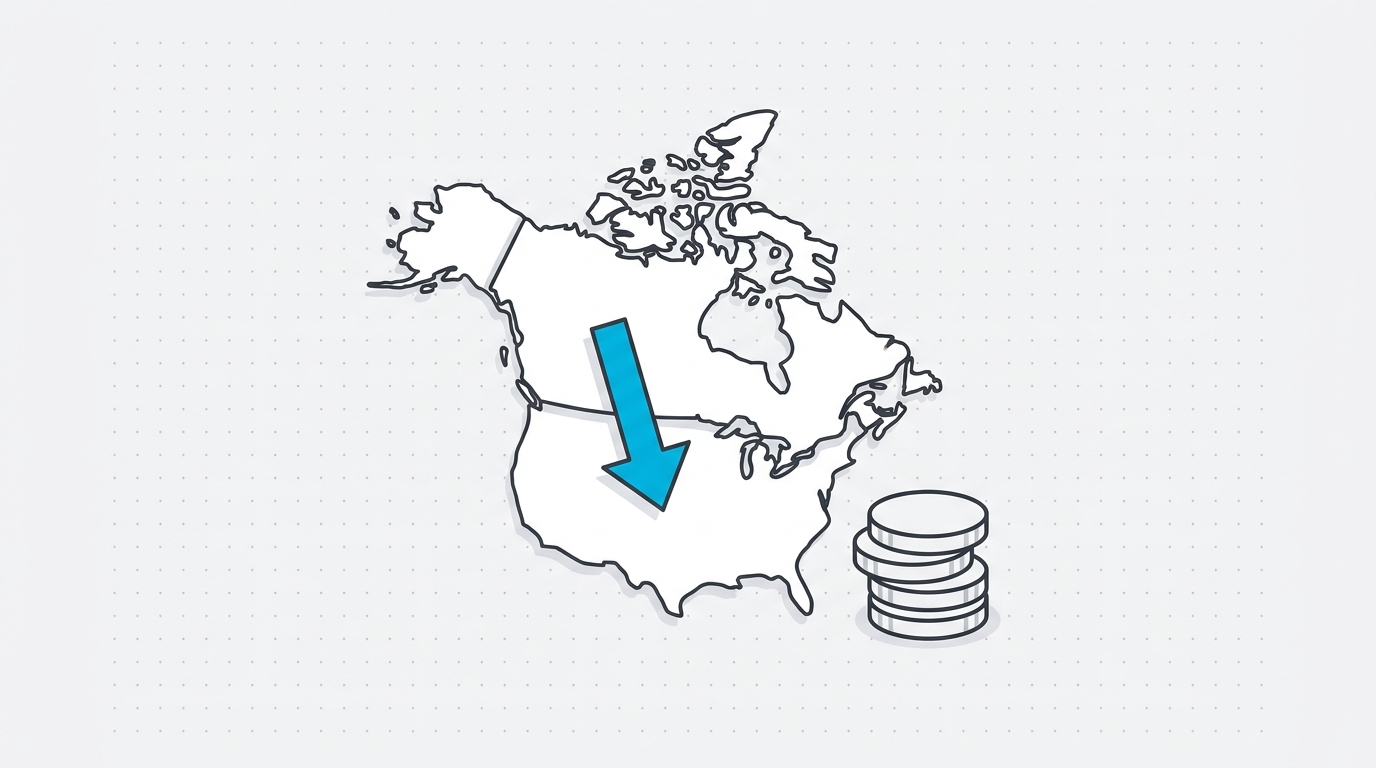
Corporate tax rate, single- vs. multi-factor apportionment, sales-tax exemptions on manufacturing equipment and utilities, and cash incentives all belong here. Federal funding initiatives drove a record-breaking $59.2 billion in economic incentive awards across the U.S. in 2024, spurring over $432 billion in capital investments and nearly half a million new jobs. The workforce piece is often the most valuable and least advertised.
A Side-by-Side Manufacturing Location Comparison
The table below is illustrative, using representative metro benchmarks for the four buckets. Treat it as a template for structuring your own manufacturing site comparison, not as final quotes. Plug your own weighted numbers into the same columns.
| Metro / State | Production Wage (approx.) | Energy (¢/kWh) | Industrial Rent ($/sq ft/yr) | Best Fit |
|---|---|---|---|---|
| Atlanta, GA | $23.97/hr | 6.54 | ~$7 | Balanced, cost-conscious |
| Charlotte / Raleigh, NC | ~$23.31/hr | 6.71 | Low | Energy-sensitive, growth |
| Columbus, OH | $26.56/hr | Mid | ~$10 | Advanced mfg, logistics |
| Detroit, MI | $27.92/hr | Mid | ~$9 | Metal fab, heavy industry |
| Kansas City, MO | Mid | Low-mid | ~$5.28 | Distribution-heavy footprint |
Wage figures reflect 2025 metro benchmarks where Detroit averages $27.92 an hour and Columbus $26.56 versus Atlanta at $23.97. Rent context: Kansas City remains one of the most affordable markets for industrial space at an average lease rate of $5.28 per square foot. Notice how the "winner" changes depending on which column carries the most weight in your product.
Don't Forget the Hidden Cost Drivers
Three costs never show up on a rate sheet but can swing a project. First, machinery. Industrial machinery prices have increased 85% since 1994, with spikes of 13.6% in 2022 and nearly 10% in 2023. If you're buying equipment, the timing and financing of that capital expenditure often outweighs a fractional difference in rent.
Second, tariffs on imported inputs. A U.S. address doesn't exempt your bill of materials from duty if you still import components. The 10% universal tariff implemented in April 2025, combined with reciprocal tariffs, increased the effective U.S. tariff rate by 15.8 percentage points, hitting machinery, fabricated metals, and advanced electronics especially hard, adding 2 to 4.5% to costs in affected sectors. If that's you, read our explainer on Section 301 tariffs and how duty drawback can recover some of it.
Third, workforce depth and training. Georgia's model shows the value: programs like Georgia Quick Start and the Technical College System offer free, tailored training and certifications, and the Hope Career Grant can cover up to 100% of tuition for students pursuing manufacturing careers. A shallow local labor pool means higher turnover and slower ramp, which never appears in a wage number.
The Manufacturing Location Checklist
Run every candidate state through the same checklist so your manufacturing location comparison stays disciplined and defensible.
- Weight your buckets first. Assign each of labor, energy, rent, and tax a percentage of your total cost so the comparison reflects your product, not an industry average.
- Get real wage data, not averages. Pull BLS metro-level production wages for your specific occupations, plus fully burdened benefit loads.
- Model energy on load, not rate. Estimate annual kWh and peak demand; demand charges can dominate a large industrial bill.
- Negotiate rent against vacancy. With vacancy at a decade high, the asking rent is negotiable, especially on longer terms.
- Score the tax and incentive package. Corporate rate, apportionment method, equipment/utility exemptions, and cash or training grants tied to job thresholds.
- Check right-to-work status and labor climate. It affects union exposure and long-run labor flexibility.
- Verify supplier and logistics proximity. Distance to inbound suppliers and outbound customers shows up as freight.
- Model imported-input tariffs. Build your bill of materials with duty on every imported component.
- Pressure-test workforce depth. Local training pipelines, community college programs, and existing industry clusters.
- Convert everything to cost per unit. The only number that lets you compare states (and overseas) on equal footing.
Comparing a U.S. State to an Overseas Option
Most brands aren't only choosing between two states. They're deciding whether to make it in the U.S. at all. The mistake is comparing a U.S. per-unit factory cost against an overseas ex-works price, which ignores freight, duty, and carrying cost.
Put both on a fully loaded basis using our landed cost method. For the overseas side, factor ocean or air freight (see sea vs. air and FCL vs. LCL), duties by HTS classification, brokerage, and the inventory you tie up in a 30- to 60-day transit. Those often close a gap that looked huge at the unit price.
If the overseas math still wins, vet the factory as carefully as you'd vet a site. Start with our factory audit checklist and, for reshoring-versus-import context, our take on India vs. China manufacturing.
Putting It Together
A credible manufacturing cost comparison by state comes down to three moves: weight your cost buckets to your actual product, pull real state-level data for each bucket instead of national averages, and convert everything to a per-unit number that you can set beside a landed-cost calculation for any overseas alternative.
Do that, and the "cheapest state" question answers itself, correctly and differently, for every product. If you want a second set of eyes on the model or help sourcing the domestic or overseas supply that feeds it, that's the work we do every day.
The commercial terms are where most of the money actually moves on an import programme, and Source With Jordan is where we publish that side of the work.
Frequently Asked Questions
Which state is cheapest for manufacturing?
There is no single cheapest state because it depends on which cost dominates your product. Southeastern states like Georgia, Alabama and North Carolina tend to win on the combination of low energy (roughly 6.5 to 6.7 cents per kWh in Atlanta and the Carolinas), competitive wages near $23 to $24 per hour, and low industrial rent. But a labor-heavy assembly line and an electricity-heavy foundry will rank states in completely different orders.
How much do manufacturing wages vary by state?
A lot. The national average for production and nonsupervisory workers is about $29.51 per hour, but Southeastern metros like Atlanta run near $23.97 while Midwest automotive hubs like Detroit run near $27.92. On a 100-person plant, a $4 per hour spread is roughly $800,000 a year in direct labor before benefits.
Do state incentives actually change the decision?
For large projects, yes. States awarded a record $59.2 billion in economic incentives in 2024, and packages now include cash grants, tax credits, and free workforce training like Georgia Quick Start. For a smaller footprint the incentive is usually a tax credit tied to job-creation thresholds, which helps but rarely flips the ranking on its own.
Should I factor tariffs into a state comparison?
Only for imported inputs. Domestic production avoids import duties on the finished good, but if your U.S. plant still imports components, tariffs flow into your bill of materials. The April 2025 universal tariff plus reciprocal duties raised the effective U.S. tariff rate by about 15.8 points, adding 2 to 4.5 percent to costs in exposed sectors, so model your input origin either way.
How do I compare a U.S. state against an overseas option?
Put both on a landed-cost basis. Add up your U.S. per-unit factory cost including labor, energy, rent and overhead, then compare it to the overseas per-unit ex-works price plus freight, duties, brokerage and inventory carrying cost. Only a fully loaded landed-cost number makes the two truly comparable.